MEX-W
 ARG-W
 ATL1
 CHI0
 DC0
 CIN0
 ORL0
 NYC0
 PHI0
 NE0
 Santos0
 Bahia1
 UAE
 NED
 PAK
 ENG
 IND-W
 ZIM-W
 GMB
 LES
 MOZ
 ZMB
 Inter Milan
 Fiorentina
 Churchill
 Punjab FC
 NGA
 UGA
 ATM1
 DEP0
 LAZ2
 PAR1
 RCL2
 PAR1
 RIY2
 TAA1
 NZ-A218/6 (66.4 ov)
 IND-A113
 SYL
 KHU
 MYMS299/4 (87 ov)
 CHATT
 DHA293/3 (84.1 ov)
 RAJ
 RAN320/5 (80 ov)
 BAR
 DEN
 PNG
 NAM321/6
 IRE290 (47.3/50 ov, target 322)
 NZ180/5
 IND181/6 (19.5/20 ov, target 181)
 WEL0
 MBV0
 Athletic
 Getafe
 C Palace
 Newcastle
 Hull
 Brentford
 Liverpool
 Brighton
 Man United
 Bournemouth
 Atalanta
 Frosinone
 CHE0
 TOT2
 VAL1
 VIL2

Europe EV Sales Report: Europe’s EV market is making a strong statement: battery-electric (BE) demand is accelerating. On Monday, August 3, 2026, the figures being discussed are striking—BE sales jumped 50% and BE reached 26% market share. However, we still need independent verification for the underlying registry source.
Here’s the thing: When BE share rises that quickly, the benefits go beyond just manufacturers. Charging operators, fleet managers, and buyers are all weighing whether they trust battery technology enough to make the switch now or hold off.
Europe BE Sales: What’s being claimed—and why this report matters?
The key claim in the Europe EV sales report is that battery-electric (BE) vehicle sales jumped 50% during the reporting period. The second claim is that BE hit 26% market share in Europe for the same timeframe. Both figures are highlighted as headline context, and the report clearly states they are not independently verifiable without a cited sales registry or industry-body source.
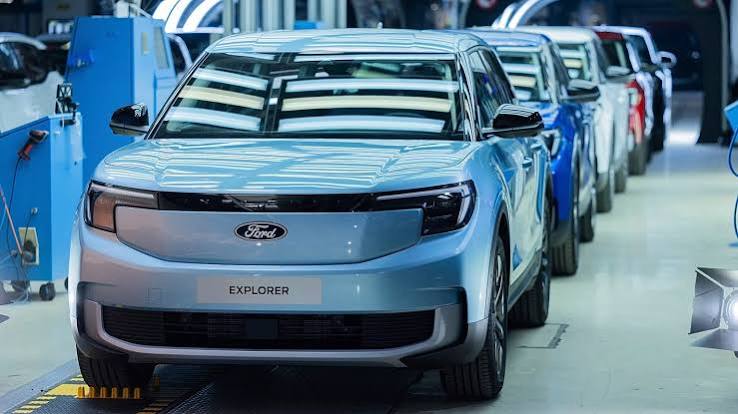
This is significant because “growth” can mean different things based on the starting point. A 50% increase can be transformative if it comes from a low base, or it might seem less impressive if the market was already booming. The market share figure is a bigger indicator: when BE achieves 26% share, it alters the competitive landscape for hybrids and charging expenses, influencing what fleets and insurers consider mainstream.
BE vs. other powertrains: How does BE reaching 26% reshape the competitive balance?
The report essentially frames the situation as a BE-versus-everything scenario. If BE share has genuinely reached 26% market share, it means roughly one in four newly sold vehicles in Europe are battery-electric—at least during the specified reporting window. That kind of level usually leads to strategic shifts across the board: automakers adjust their model mix, suppliers focus on BE components, and infrastructure planning speeds up.
This headline doesn’t break down individual manufacturers or models, so we can’t pinpoint which brands or segments fueled this surge. Still, we can understand the strategic implications. A BE share above the mid-20s often pressures competitors to rethink pricing and incentives, particularly for internal-combustion (ICE) and plug-in hybrid (PHEV) lineups. Buyers notice it through availability, promotions, and delivery schedules—these factors influence what sells in the coming month.
Europe EV sales report: A side-by-side look at what we can state vs. what we can’t
| What’s in the headline context | What’s missing for verification |
|---|---|
| BE sales jumped 50% (unverified) | No cited industry body or registry source |
| BE market share reached 26% (unverified) | No time series (month/quarter) details provided |
| Report date referenced: Mon, Aug 3, 2026 | No country-level split (EU vs UK vs EEA) |
If you want to validate the numbers, compare them against trusted industry reporting channels—then cross-check commentary on charging and adoption trends. For broader market context, keep an eye on coverage from outlets like Motor Trend at Motor Trend and consumer tech insights.
Strengths and weaknesses of this “BE surge” narrative
The strength of this narrative is straightforward: market share is harder to fake than raw volume. If BE has genuinely reached 26%, it suggests not only higher sales but also a shift in consumer preferences and product availability. This level usually aligns with increased charging confidence and better unit economics over time, even if individual buyers still have concerns about range.
On the flip side, verification is a weakness. The numbers are described as stemming from the headline and explicitly need confirmation from a registry. Without the underlying data, we can’t tell if the 50% increase is due to a spike in one country, a seasonal trend, or a broader pan-European rise.
The story could be directionally correct while still lacking precision, and that precision is crucial for decision-makers—especially fleets planning their purchase orders, since procurement cycles can take months.
Recommendation: Who should act on this report—and who should wait for proof?
If you’re a buyer or fleet manager considering a switch, approach with caution. For those being careful, it’s wise to treat the headline as an indicator, not a guarantee: ask for the registry citation or wait for further coverage that includes the source.
If BE share is indeed at 26%, then the pressure to mainstream is real. Waiting too long could lead to fewer options at the right time.
For manufacturers and supply-chain teams, the headline still holds value. BE adoption momentum at the mid-20s share range usually prompts prioritization of investments—in battery materials, motor production, thermal systems, and service training. For infrastructure planners, a BE-heavy mix signals that charging demand planning can’t remain speculative.
Here’s the takeaway for today: Use the BE growth headline to gauge direction, but rely on verified registry numbers to set timelines.
FAQ
Is the “50% BE sales jump” confirmed by an industry body?
In this context, the 50% jump is unconfirmed and requires verification from a cited sales registry or industry-body source.
Does “26% market share” apply to all of Europe or specific countries?
The provided context doesn’t clarify the exact geography beyond “Europe”. Verification from the underlying dataset is essential.
Should Indian buyers pay attention, considering this is a European report?
Absolutely—Europe shapes global product roadmaps and battery scaling decisions, which can impact timelines, availability, and pricing strategies elsewhere, including India. Stay tuned for more on the Europe EV sales report.