

The Nifty 50 index continued its downward trend for the third consecutive session on December 18, 2024, as bears maintained control over Dalal Street. The index fell by more than half a percent, slipping below all key moving averages and the midline of the Bollinger Bands, signaling weakness. The Put-Call Ratio (PCR) dropped to 0.55, its lowest-ever level, indicating oversold conditions.
Table of Contents
On the technical front, if the Nifty 50 holds the 24,150 level, a rally towards 24,500 cannot be ruled out. However, a fall below this level could push the index into the 24,000-23,900 zone, which will act as a key support area.
Here’s a detailed breakdown of the Nifty 50 chart, key levels, and other market indicators to help you prepare for Thursday’s trading session.
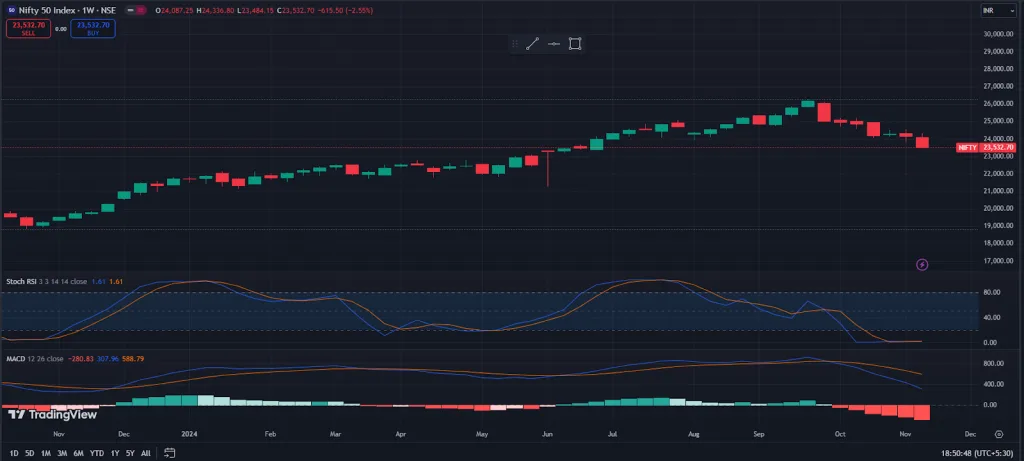
Nifty 50 Chart: Key Levels to Watch
- Resistance Levels:
- 24,341, 24,399, and 24,492 (based on pivot points).
- The 25,500 strike holds the maximum Call open interest, making it a key resistance level in the short term.
- Support Levels:
- 24,150 is a critical support level. If breached, the index could test the 24,000-23,900 zone.
- The 24,000 strike holds the maximum Put open interest, reinforcing it as a strong support level.
- Technical Indicators:
- The Relative Strength Index (RSI) is at 45.18, showing a negative crossover, which indicates bearish momentum.
- The index has formed a bearish candlestick pattern with a lower high-lower low formation for the second consecutive session, signaling selling pressure at higher levels.

Bank Nifty Chart: Key Levels
The Bank Nifty also witnessed a bearish session, dropping 1.32% on Wednesday and 2.7% for the week.
- Resistance Levels:
- 52,638, 52,831, and 53,143 (based on pivot points).
- The 54,000 strike holds the maximum Call open interest, making it a key resistance level.
- Support Levels:
- 52,014, 51,821, and 51,509 (based on pivot points).
- The 50,000 strike holds the maximum Put open interest, acting as a strong support level.
- Technical Indicators:
- The index has dropped below the 10-day, 20-day, and 50-day EMAs, signaling weakness.
- Momentum indicators like RSI and MACD have shown negative crossovers, further confirming bearish sentiment.
Key Market Indicators
1. Put-Call Ratio (PCR)
The Nifty PCR dropped to 0.55, its lowest-ever level, indicating oversold conditions. A PCR below 0.7 reflects a bearish mood, as traders are selling more Calls than Puts.
2. India VIX
The India VIX, a measure of market volatility, dropped by 0.78% to 14.37. While this is a slight improvement, elevated volatility levels continue to discomfort bulls.
3. Options Data
- Call Options:
- Maximum Call open interest was seen at the 25,500 strike, followed by the 25,000 and 24,300 strikes.
- Maximum Call writing was observed at the 24,300 strike, indicating strong resistance at this level.
- Put Options:
- Maximum Put open interest was seen at the 24,000 strike, followed by the 24,200 and 23,500 strikes.
- Maximum Put writing was observed at the 24,200 strike, reinforcing it as a key support level.
Stocks to Watch
- Long Build-Up:
- 16 stocks showed a long build-up, indicating an increase in open interest (OI) along with a price rise.
- Short Build-Up:
- 113 stocks saw a short build-up, with an increase in OI and a price decline, signaling bearish sentiment.
- High Delivery Trades:
- Stocks with a high share of delivery trades reflect strong investing interest.
- Stocks Under F&O Ban:
- Stocks like Bandhan Bank, Chambal Fertilisers, Granules India, and RBL Bank remain under the F&O ban.
Conclusion
The Nifty 50 chart indicates bearish sentiment, with the index falling below key moving averages and forming a bearish candlestick pattern. However, oversold conditions, as reflected by the low Put-Call Ratio (PCR), suggest the possibility of a short-term bounce if the index holds the 24,150 level.
Traders should closely monitor key resistance and support levels, along with options data, to identify profitable opportunities. While volatility remains elevated, a decline in the India VIX could provide some relief to bulls. For now, the 24,150 level remains critical for the Nifty 50, with a potential rally towards 24,500 if it holds.
Read More: Inventurus Knowledge Solutions IPO Listing Today: Should You Buy, Sell, or Hold?
FAQs
1. What are the key resistance and support levels for the Nifty 50?
Resistance Levels: 24,341, 24,399, and 24,492. The 25,500 strike also acts as a key resistance level based on Call open interest.
Support Levels: 24,150 is a critical support level. If breached, the index could test the 24,000-23,900 zone, with the 24,000 strike holding the maximum Put open interest.
2. What does the Nifty 50 chart indicate for the coming sessions?
The Nifty 50 chart shows bearish momentum, with the index forming a lower high-lower low pattern and falling below key moving averages. However, if the index holds 24,150, a rally towards 24,500 is possible. A breach of this level could lead to further downside towards 24,000-23,900.