
India’s 2-2 drawn series against England revealed a tale of statistical supremacy that failed to translate into tangible success. Despite outperforming their hosts across virtually every metric, the visitors were undone by crucial unforced errors and fielding lapses that turned potential victory into frustrating stalemate.
Table of Contents
India’s Dominance by Numbers Tells Story of What Could Have Been
The recently concluded England vs India Test series painted a compelling picture of cricket’s cruel ironies. While the 2-2 scoreline suggests an evenly contested battle, the underlying statistics reveal a stark truth: Indian cricket team dominated their hosts in almost every conceivable way, yet walked away without the series victory their performances merited.

Statistical Supremacy Across All Departments
India’s comprehensive dominance becomes evident when examining the key performance indicators throughout the five-match series. The visitors outclassed England in batting, bowling, and even in creating pressure situations, yet somehow failed to convert this superiority into series victory.
| Series Comparison | India | England |
|---|---|---|
| Batting Average | 39.77 | 37.57 |
| Centuries/Half-centuries | 12/16 | 9/13 |
| Pace Bowling Average | 34.95 | 36.53 |
| Pace Bowling Strike Rate | 50.7 | 62.8 |
| Spin Bowling Average | 55.51 | 72.56 |
| Spin Bowling Strike Rate | 92.7 | 122.6 |
These numbers paint an unambiguous picture: India’s batters scored more runs per dismissal, hit more centuries, and their bowlers took wickets faster and more economically than their English counterparts.
The False Shot Phenomenon
Perhaps the most telling statistic of Indian cricket team’s dominance came in their ability to create uncertainty among England’s batters. Indian bowlers induced 21% false responses from England batters compared to just 16% extracted by the home team’s attack—a significant 5% difference that highlighted India’s superior bowling performance.
This false shot differential was remarkably consistent throughout the series. In four of the five Tests, Indian bowlers consistently drew more false shots from England batters, with margins exceeding 5% in each case. Only in the drawn Manchester Test did England manage to marginally outperform India in this crucial metric.
| False Shot Analysis by Test | India % | England % | Difference |
|---|---|---|---|
| 1st Test, Headingley | 17.3 | 22.6 | 5.3 |
| 2nd Test, Edgbaston | 9.7 | 16.2 | 6.5 |
| 3rd Test, Lord’s | 15.7 | 21.9 | 6.2 |
| 4th Test, Old Trafford | 14.8 | 13.6 | 1.2 |
| 5th Test, The Oval | 25.8 | 31.8 | 6.0 |
The Unforced Error Catastrophe
Despite their statistical dominance, India’s Achilles heel emerged in the form of self-inflicted wounds. The visitors lost a staggering 22 wickets to deliveries they were fully in control of, compared to England’s mere nine such dismissals. This crucial difference proved to be the defining factor that prevented India from securing a deserved series victory.
The pattern of unforced errors plagued India throughout the series, often at the most crucial junctures. Captain Shubman Gill’s dismissal off Shoaib Bashir in the opening Test exemplified this trend, triggering a collapse from the commanding position of 430/3 to 471 all out.
Key Moments That Defined the Series
Several critical moments highlighted Indian cricket team’s tendency toward self-destruction when positioned for dominance:
Headingley Horror: Rishabh Pant’s attempt to accelerate against Bashir in the second innings saw India collapse from 287/3 with a substantial lead to 364 all out, squandering a winning position.
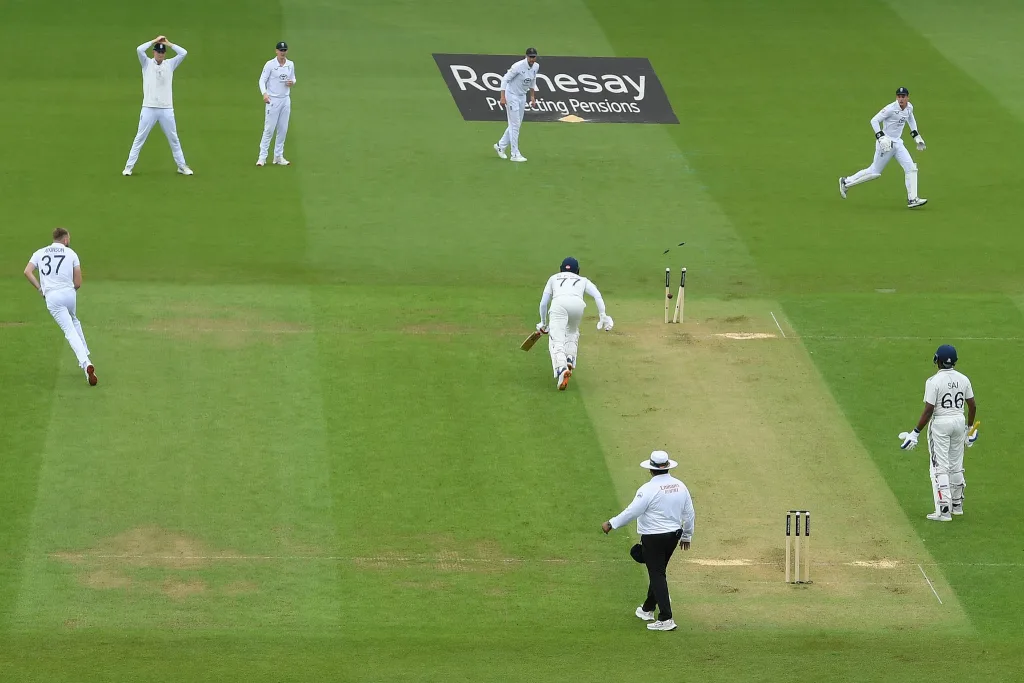
Lord’s Lunacy: Pant’s untimely run-out just before lunch provided England with an unexpected opening after what had been a wicketless session for the hosts.

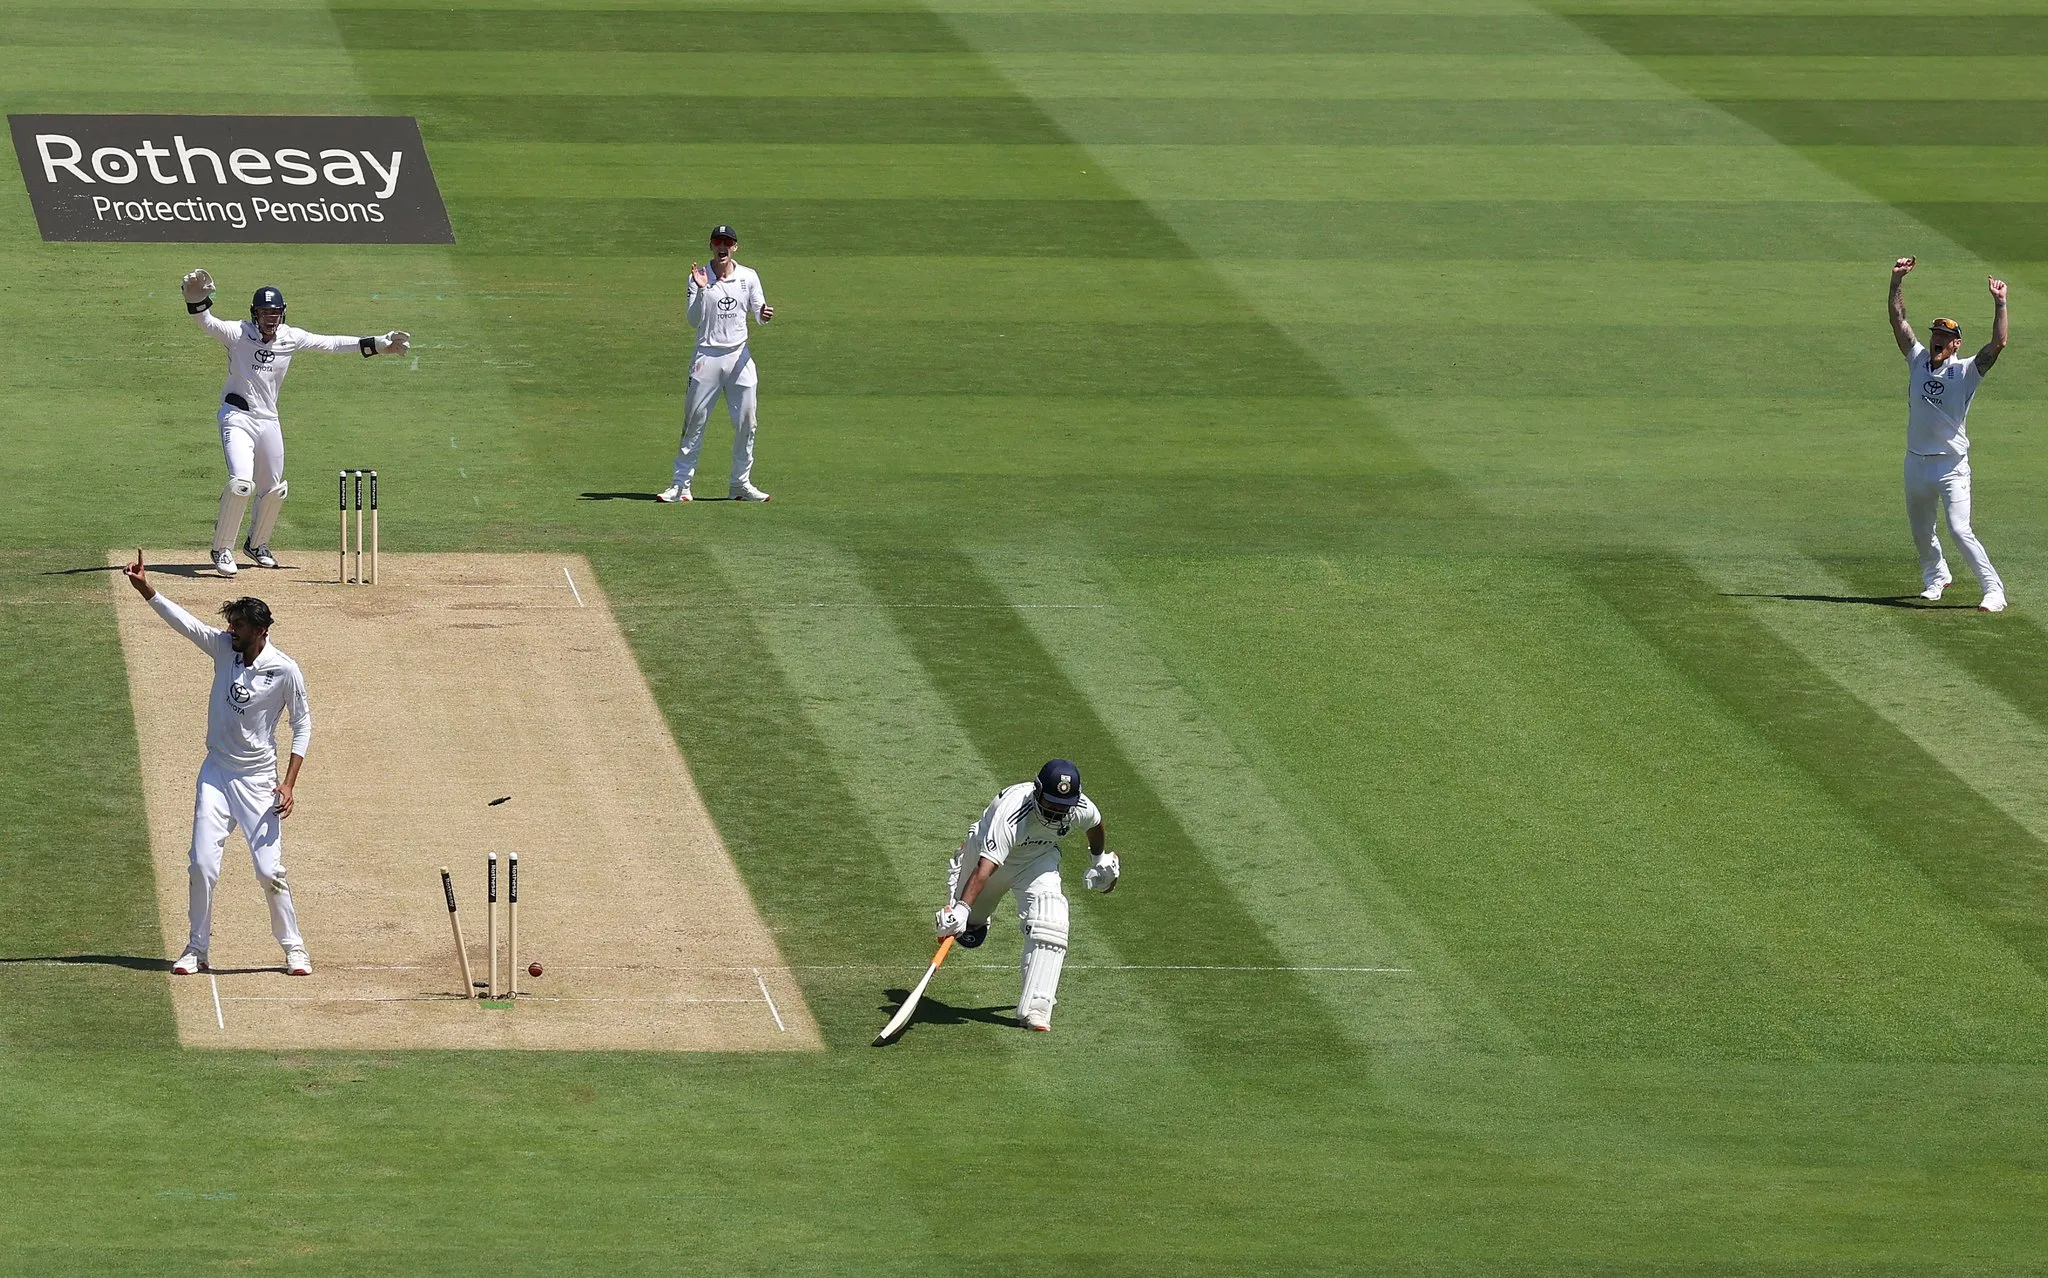
Siraj’s Misfortune: Perhaps the most symbolic moment came when Mohammed Siraj, despite middling a delivery from Bashir, watched helplessly as the ball rolled back onto the stumps with sufficient force to dislodge the bails.
Fielding Lapses Compound India’s Woes
The statistics reveal another crucial area where Indian cricket team’s superiority was undermined by execution failures. India dropped 23 catches compared to England’s 17, a difference that cost them an additional 718 runs while England conceded only 587 runs through dropped chances.
| Dropped Catches Impact | India | England |
|---|---|---|
| Total Catches Dropped | 23 | 17 |
| Additional Runs Conceded | 718 | 587 |
| Net Impact | -131 runs | +131 runs |
This 131-run swing through fielding errors alone could have altered the outcome of multiple matches, particularly considering that two Tests were decided by margins of fewer than 25 runs.
Individual Performances Tell the Tale
Harry Brook emerged as England’s Player of the Series largely due to Indian fielding lapses. The English batsman scored 240 of his 481 series runs after being dropped for the first time in respective innings—effectively half his total contribution came courtesy of Indian generosity.

Brook’s good fortune extended beyond dropped catches. His dismissal off a Jasprit Bumrah no-ball in the Leeds Test, before he had even opened his account, allowed him to score 99 and further emphasized how crucial moments favored England despite India’s superior performance.
Batters Adding 100+ Runs After Drops:
- Harry Brook (England): 240 additional runs
- Jamie Smith (England): 130 additional runs
- Ollie Pope (England): 123 additional runs
- Ravindra Jadeja (India): 120 additional runs
The Changing Tide of Fortune
Interestingly, the fortune gradually shifted as the series progressed. After the Lord’s Test, the dropped catches ratio heavily favored England (7 to 18), costing India 573 additional runs compared to England’s 230. However, in the final two Tests, the ratio reversed to 10-5 against England, with additional runs accruing 357 for England and only 145 for India.
This late-series improvement in fielding allowed Indian cricket team to salvage draws in crucial matches, with Yashasvi Jaiswal and Akash Deep both benefiting from dropped chances to rescue India’s position in the final Test.
Historical Context and Broader Implications
This drawn series continued England’s winless streak against major opposition, marking their inability to defeat either India or Australia, home or away, since 2019. The 2-2 result represents the fourth drawn series England has played against these powerhouses during this period, all occurring on home soil.
The series joins an exclusive group of rubbers where teams were separated by fewer than 25 runs at the end of their respective first innings in three of five games—only the second such instance in cricket history. Additionally, two matches being decided by margins under 25 runs created another unprecedented scenario.
Lessons for Future Encounters
Indian cricket team’s experience in this series provides valuable lessons about converting dominance into results. Despite superior statistics across batting, bowling, and pressure creation, mental lapses and fielding errors prevented the visitors from achieving what their performance levels deserved.
The series highlighted cricket’s fundamental truth: statistical superiority means nothing without execution in crucial moments. India’s failure to capitalize on their comprehensive advantages serves as a reminder that cricket matches are won through sustained concentration and error-free execution rather than mere statistical dominance.
For England, the series victory felt hollow given their inferior performance across most metrics. However, their ability to capitalize on opposition errors and maintain composure during crucial moments demonstrated the value of mental resilience in Test cricket.
Looking Forward
This series will be remembered as one where the better team failed to win, undermined by self-inflicted wounds rather than opposition brilliance. For India, the experience serves as a stark reminder that talent and statistical dominance must be complemented by mental fortitude and fielding excellence to achieve success at the highest level.

The drawn result, while maintaining England’s home record, highlighted the fine margins that separate victory from disappointment in international cricket, where a handful of unforced errors can override weeks of superior performance.
Read More: The Siraj Phenomenon: Why India’s Pace Spearhead Thrives in Bumrah’s Absence
FAQs
What was the final result of the England vs India Test series?
The series ended in a 2-2 draw, with Indian cricket team failing to convert their statistical dominance into a series victory despite outperforming England in most key metrics.
How many unforced errors did India make compared to England?
Indian cricket team lost 22 wickets to deliveries they were in control of, while England lost only 9 such wickets, highlighting the crucial difference in self-inflicted dismissals.
What was the impact of dropped catches on the series?
India dropped 23 catches compared to England’s 17, costing them an additional 718 runs while England conceded only 587 runs through fielding errors.
Who was England’s standout performer and why?
Harry Brook was named Player of the Series, scoring 240 of his 481 runs after being dropped, demonstrating how fielding lapses benefited England throughout the series.
How did India’s bowling performance compare to England’s?
India’s bowlers were superior across all metrics: pace bowlers averaged 34.95 vs 36.53, spinners averaged 55.51 vs 72.56, and they induced 21% false shots vs England’s 16%.